Project information
- Tools: Python, Citipy, APIs (OpenWeatherMap, Google Places), jupyter-gmaps
- Project URL: Github
Python Weather API Challenge
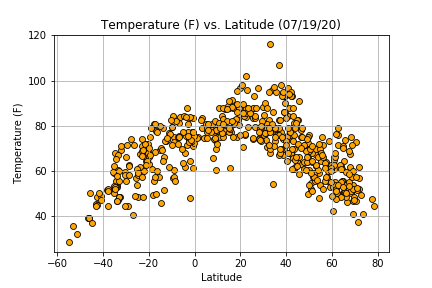
WeatherPy: Created scatter plots of the weather of 500+ cities across the world of varying distance from the equator to prove that the weather does indeed get hotter as we approach the equator.
Scatter plots showcase:
- Temperature (F) vs. Latitude
- Humidity (%) vs. Latitude
- Cloudiness (%) vs. Latitude
- Wind Speed (mph) vs. Latitude
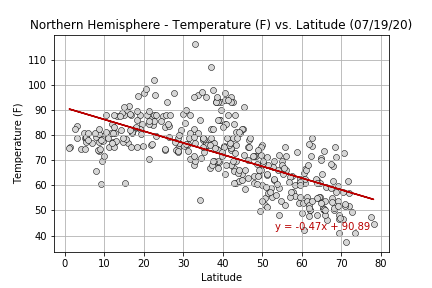
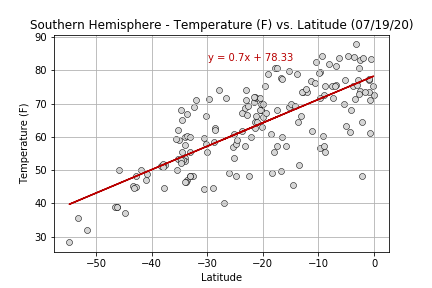
Linear regressions were ran on each relationship for the Northern hemisphere (greater than or equal to 0 degrees latitude) and Southern hemisphere (less than 0 degrees latitude) separately:
- Northern Hemisphere - Temperature (F) vs. Latitude
- Northern Hemisphere - Humidity (%) vs. Latitude
- Northern Hemisphere - Cloudiness (%) vs. Latitude
- Northern Hemisphere - Wind Speed (mph) vs. Latitude
- Southern Hemisphere - Temperature (F) vs. Latitude
- Southern Hemisphere - Humidity (%) vs. Latitude
- Southern Hemisphere - Cloudiness (%) vs. Latitude
- Southern Hemisphere - Wind Speed (mph) vs. Latitude
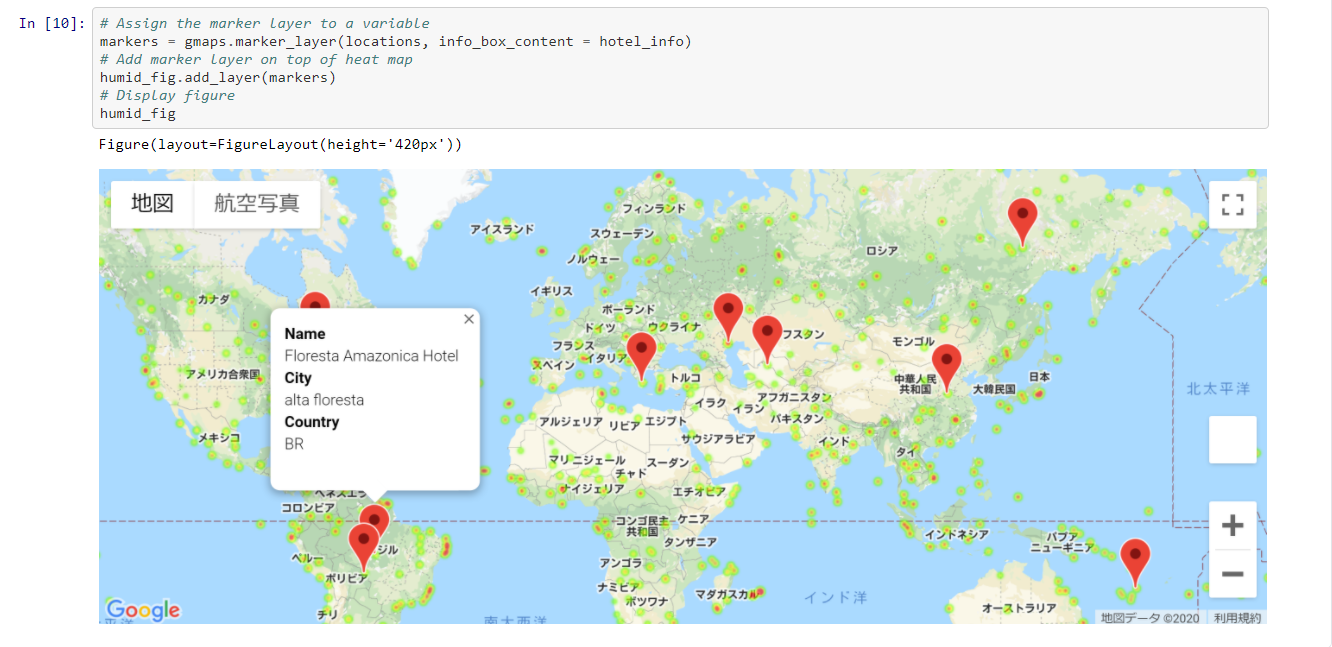
VacationPy: Use jupyter-gmaps and the Google Places API to create a heatmap of these cities, filter the cities with an ideal weather condition and find the nearest hotel.