Project information
- Tools: JavaScript, D3.js, HTML/CSS
- Project URLs:
- Github
- Website (hosted on Github Pages)
D3 Challenge
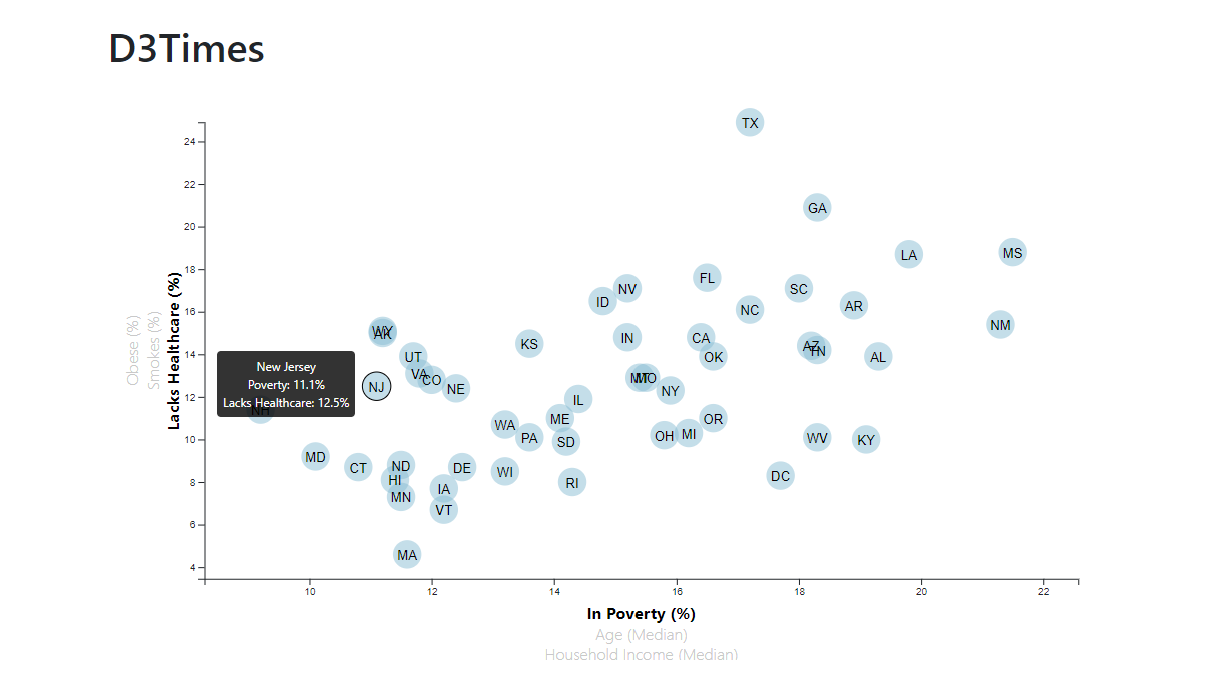
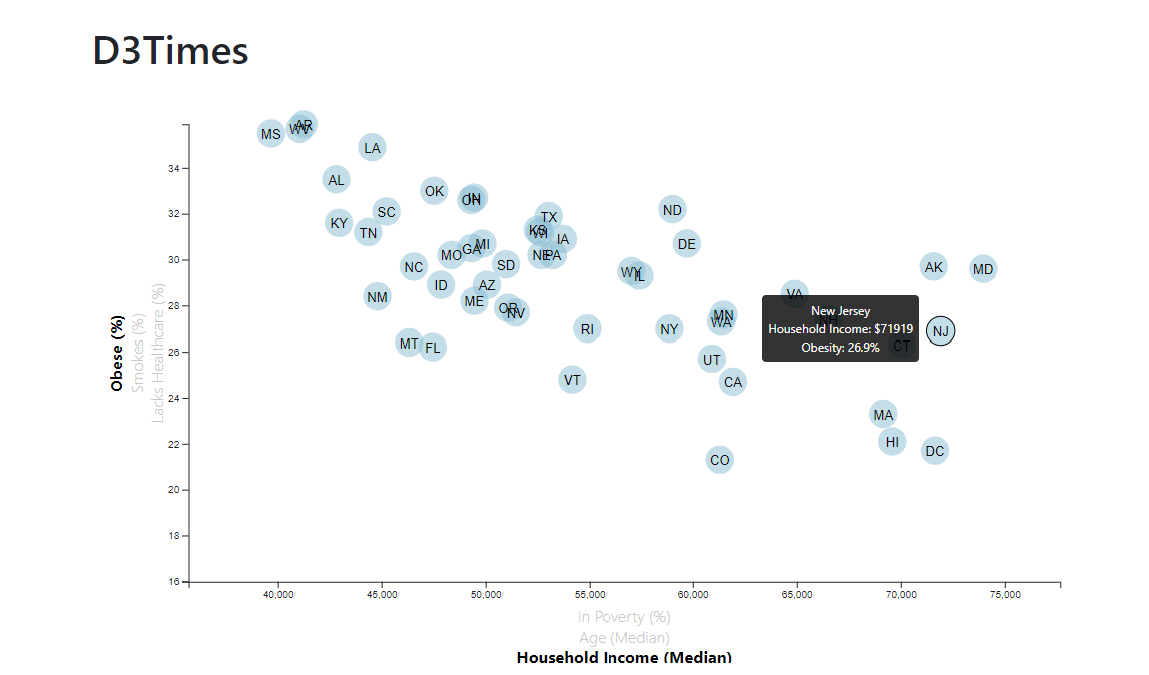
Constructed a dynamic scatter plot with three risk factors (% obese, % smokes, % lacks healthcare) on the y-axis and three particular demographics (% in poverty, median age, median household income) on the x-axis using data based on 2014 ACS 1-year estimates.
Users can decide which data to display by clicking on the provided labels, and the circles and axes will transition to their new locations/ranges in a smooth animation.