Project information
- Tools: JavaScript, Leaflet, HTML/CSS
- Project URL: Github
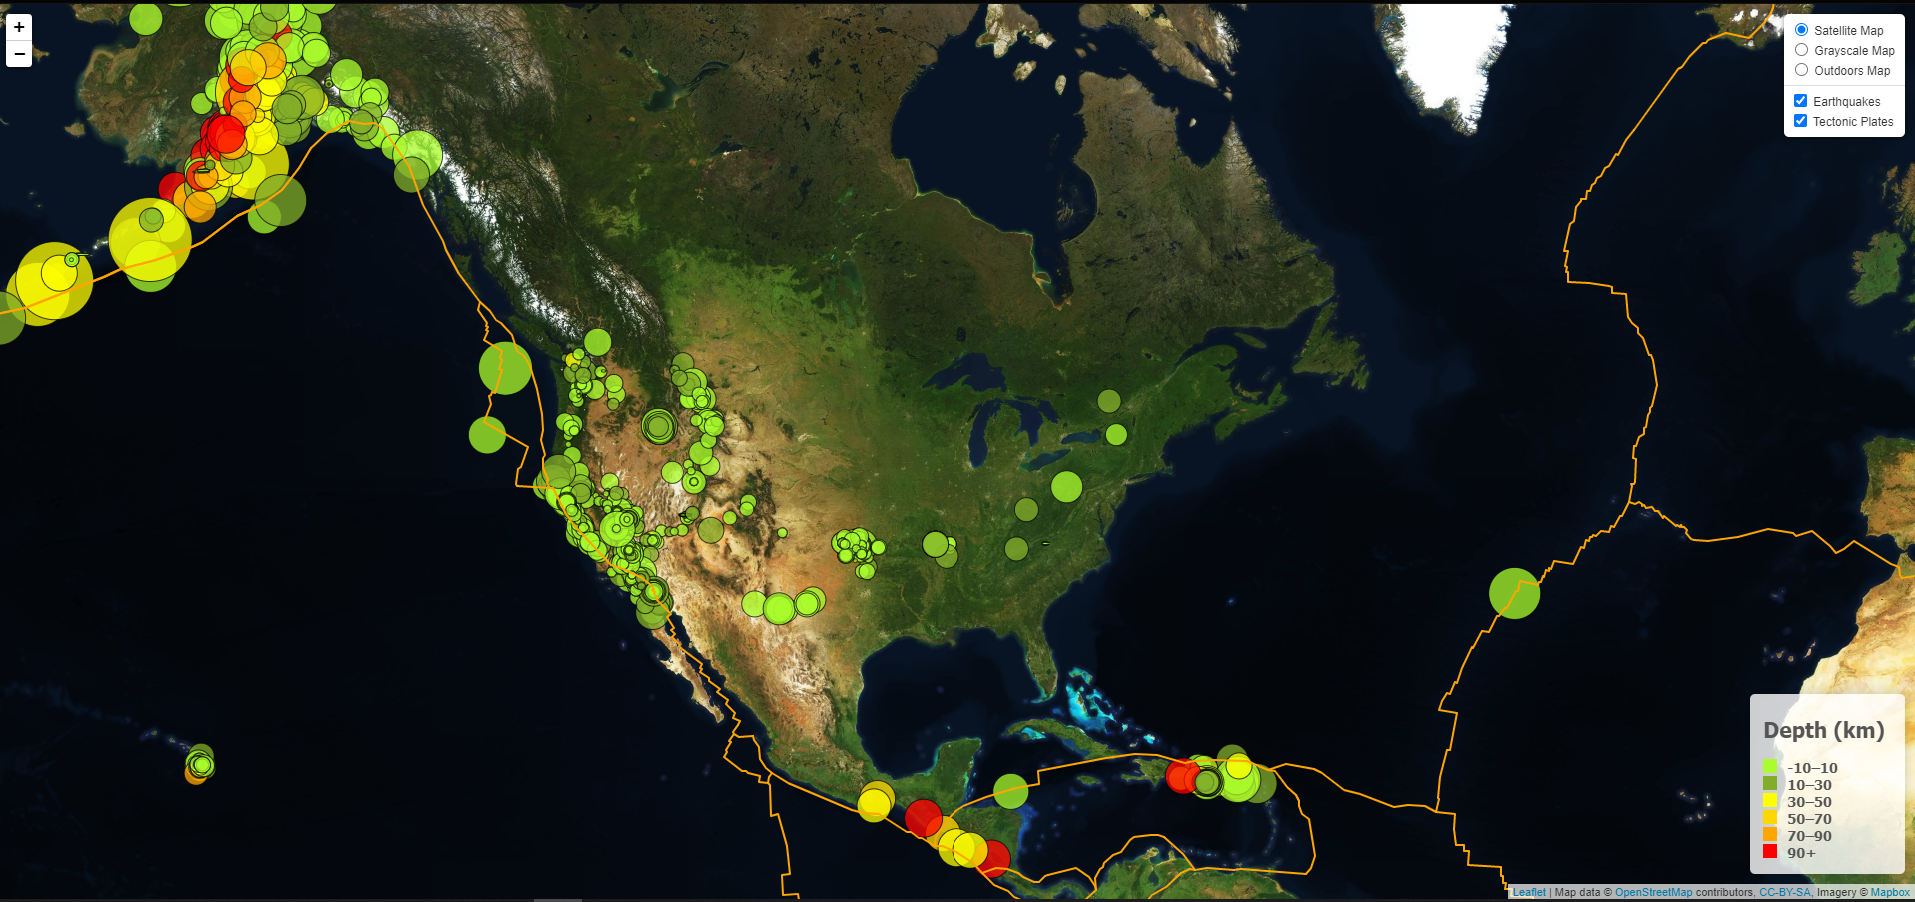
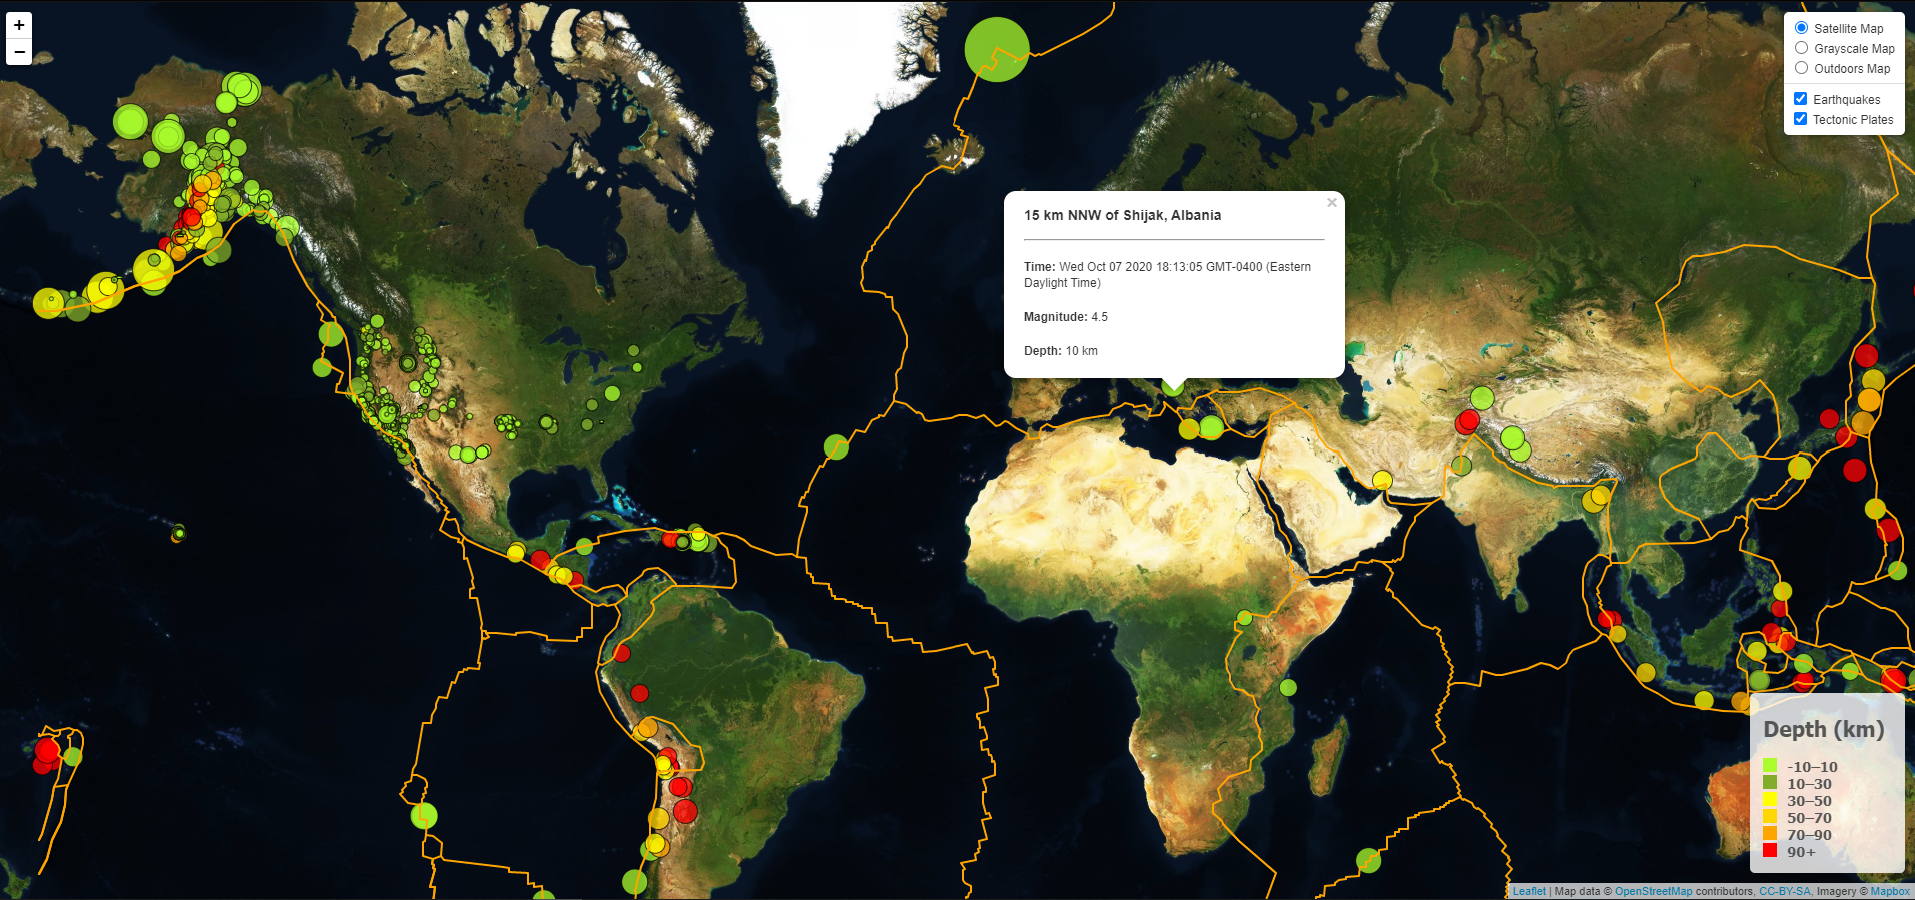
Leaflet Challenge
Constructed a map using Leaflet that plots the data from the "All Earthquakes from the Past 7 Days" data set that can be found on the USGS GeoJSON Feed page to visualize the earthquakes based on their longitude and latitude coordinates as well as data on tectonic plates to illustrate the relationship between tectonic plates and seismic activity.