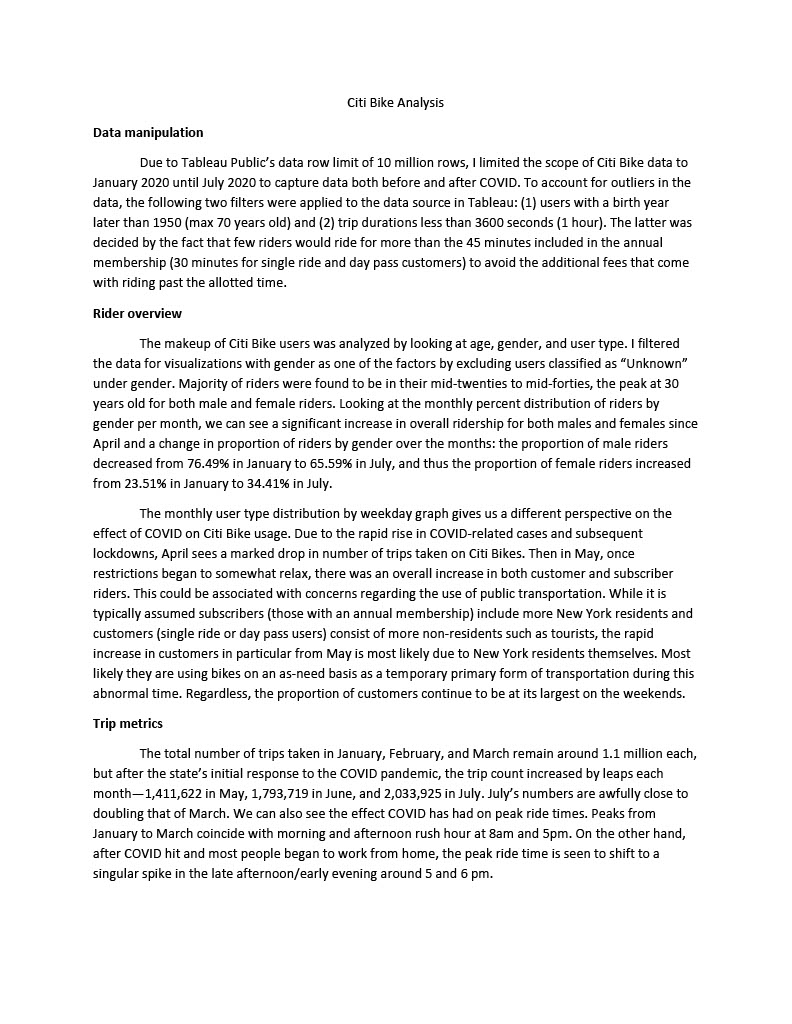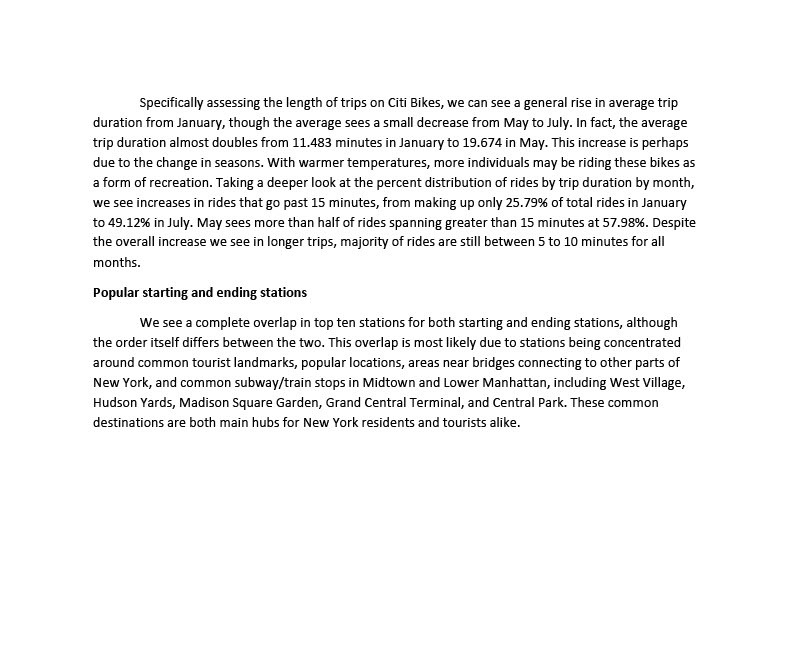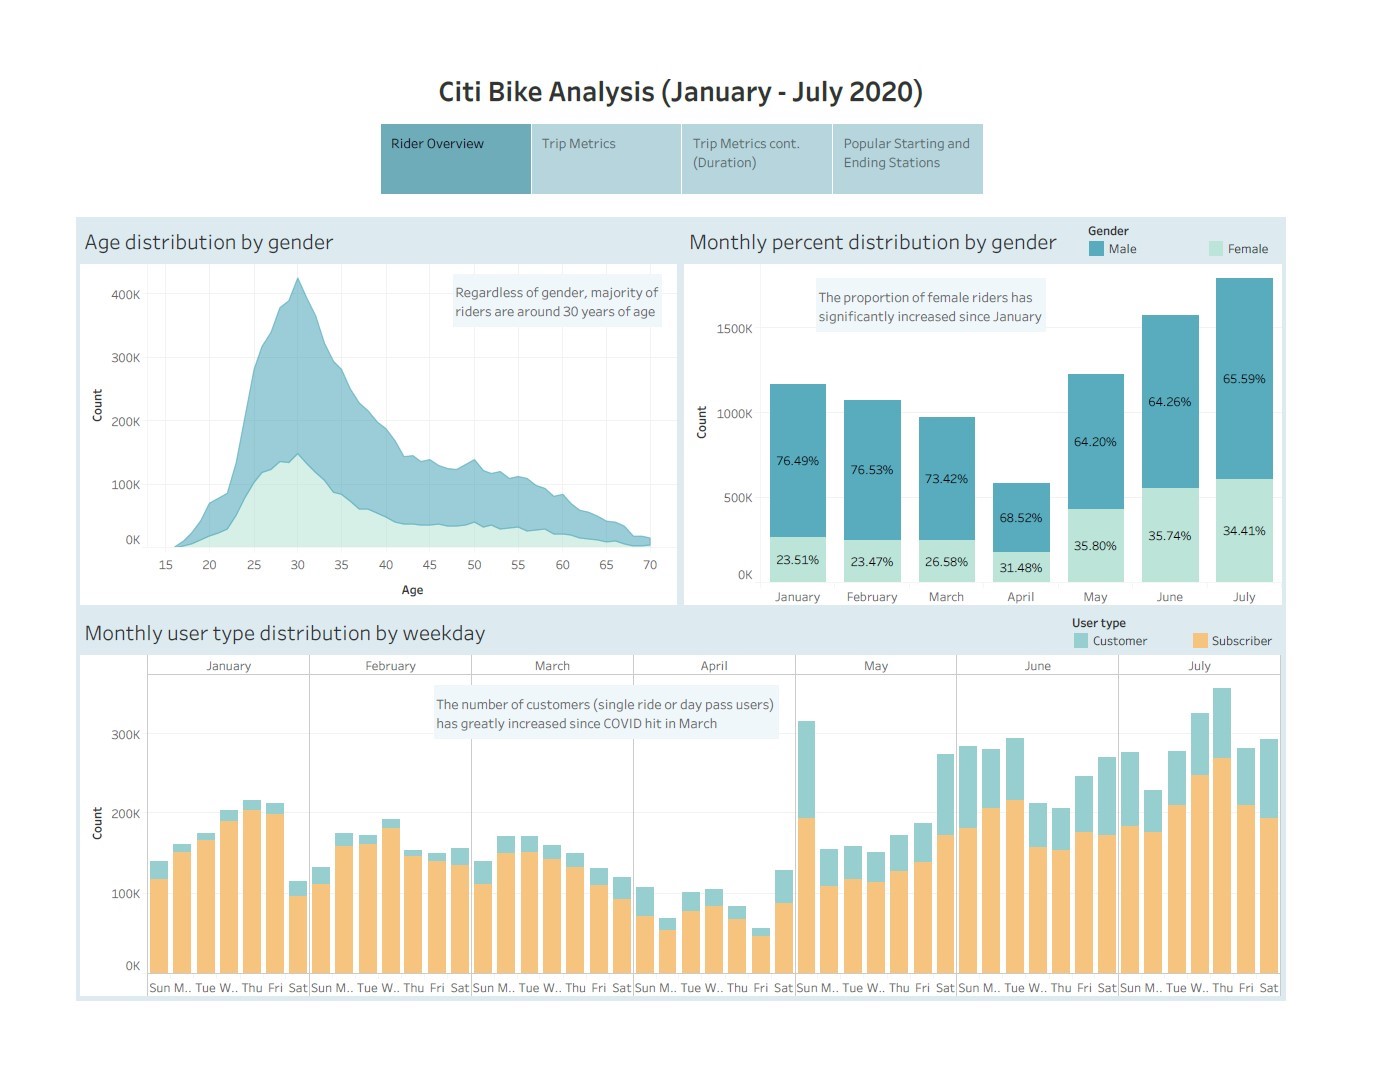
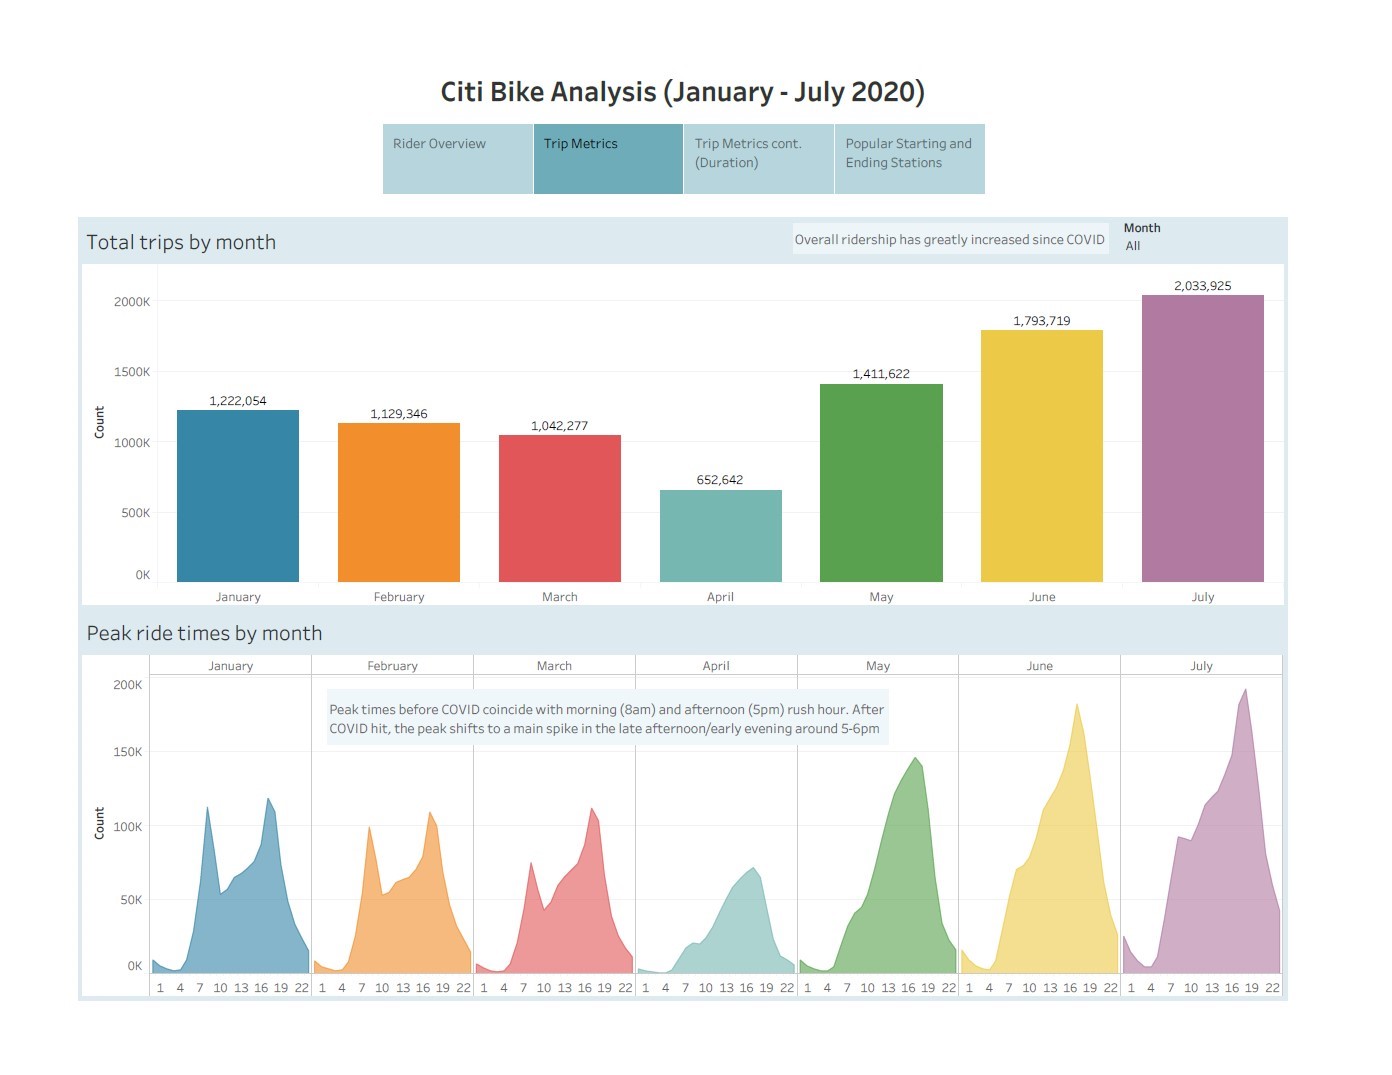
Project information
- Tools: Tableau, Alteryx
- Project URLs:
- Tableau Public
- Github (with Analysis)
Citi Bike Tableau Dashboard
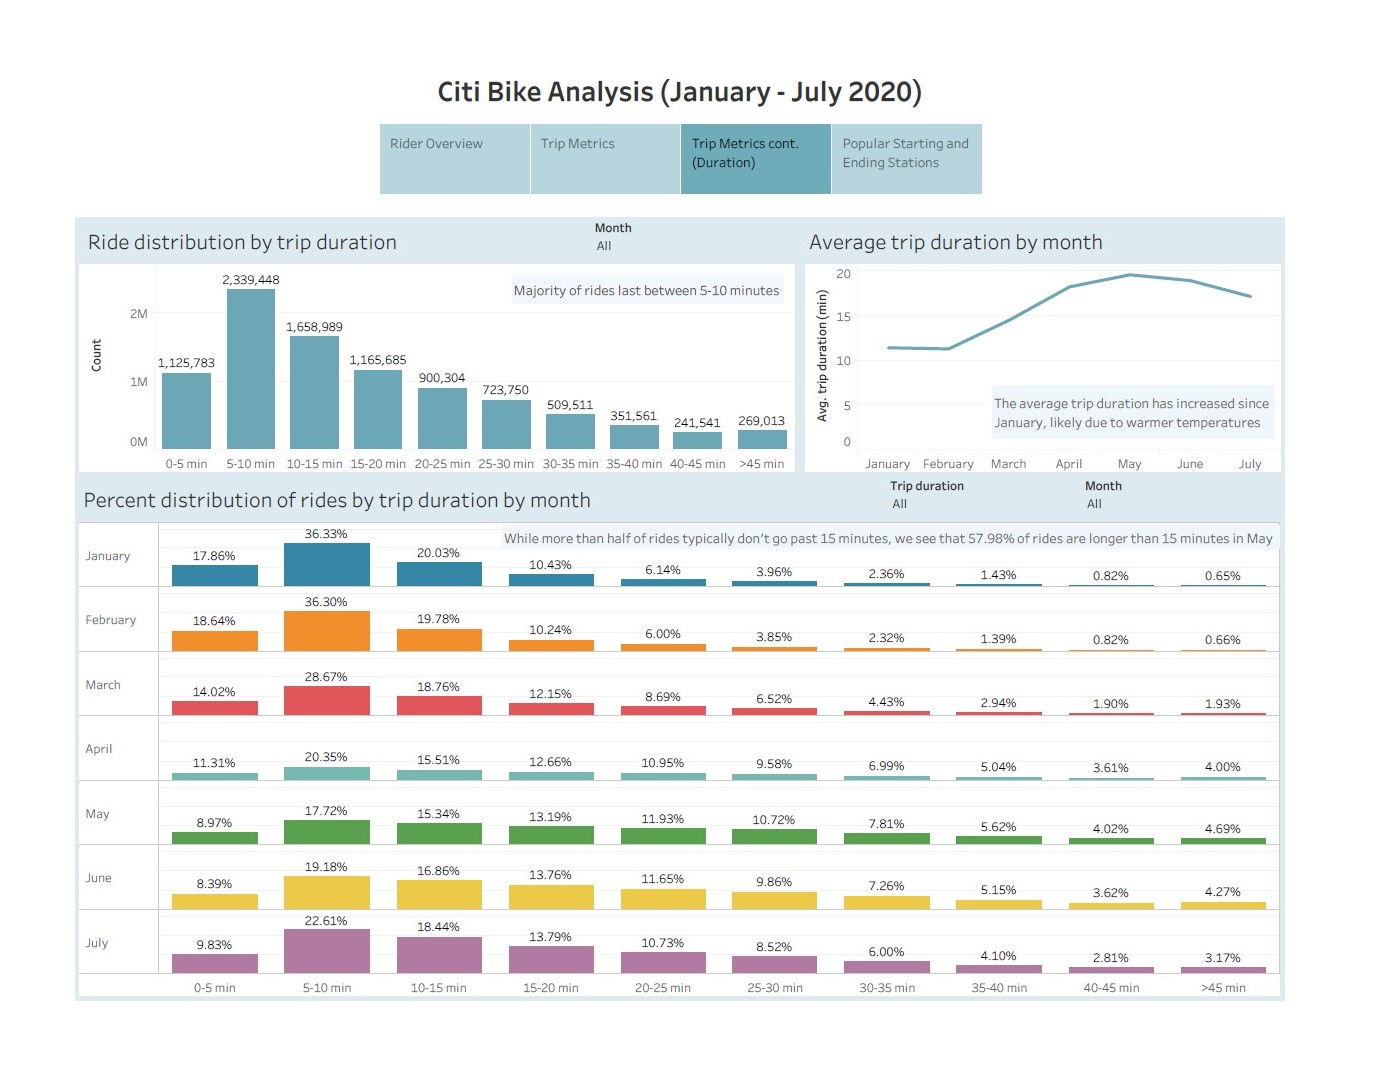
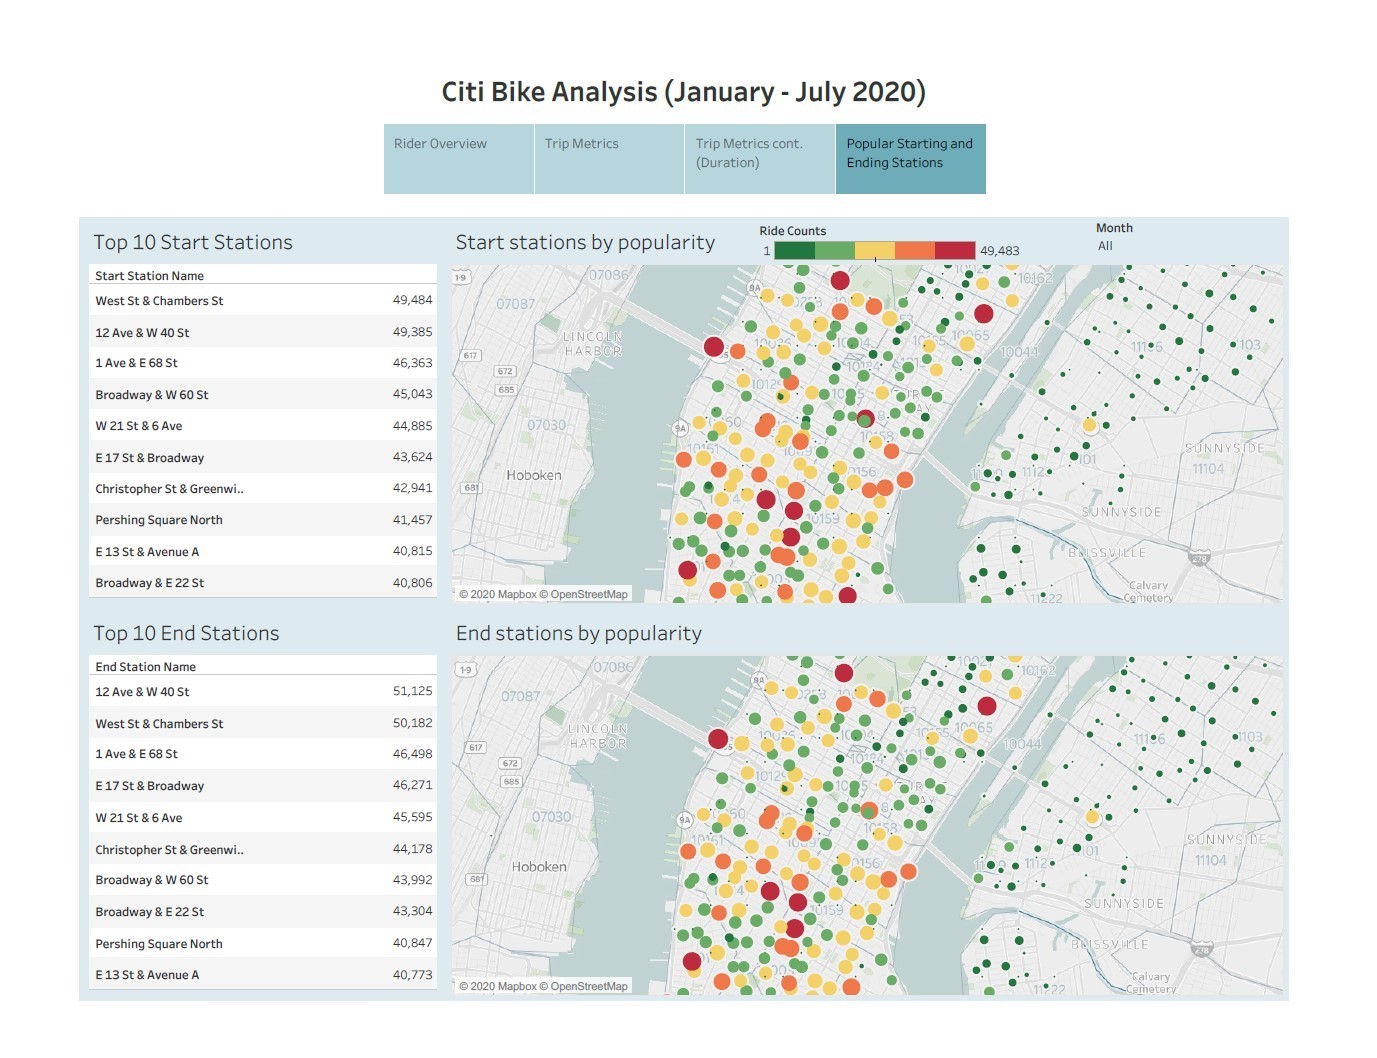
Created visualizations providing insight into rider profile, trip metrics, and popular starting/ending stations created using monthly CSV files (January - July 2020) from the Citi Bike NYC Data webpage, which were cleaned and combined in Alteryx.
Original data set includes:
- Trip Duration (seconds)
- Start Time and Date
- Stop Time and Date
- Start Station Name
- End Station Name
- Station ID
- Station Lat/Long
- Bike ID
- User Type (Customer = 24-hour pass or 3-day pass user; Subscriber = Annual Member)
- Gender (Zero=unknown; 1=male; 2=female)
- Year of Birth
Analysis write-up on Github:
